


Natsiopoulos T. DVM, MRCVS, Dick White Referrals, Station Farm, London Road, Six Mile Bottom, CB80UH, Cambridgeshire, UK
Tappin S. MA VetMB, CertSAM, Dip ECVIM-CA, FRCVS, Dick White Referrals, Station Farm, London Road, Six Mile Bottom, CB80UH, Cambridgeshire, UK
Shing H. 3BVSc, MRCVS, GradCert (SAUA), MANZCVS (Small Animal Radiology), Dick White Referrals, Station Farm, London Road, Six Mile Bottom, CB80UH, Cambridgeshire, UK
Mantis P. DVM, FHEA, DipECVDI, FRCVS, Dick White Referrals, Station Farm, London Road, Six Mile Bottom, CB80UH, Cambridgeshire, UK
MeSH keywords:
cats, computed tomography, cortical thickness, kidney, renal dimensions, renal
Abstract
This is a single-centre, retrospective study aimed to determine the renal length, width, height, and the thickness of the renal cortex of normal functioning kidneys in a population of eleven domestic shorthair and three domestic longhair cats in the UK. A total of 14 cats, ten female neutered and four male neutered cats, with normal renal function were included in the study. The normal renal function was considered based on normal renal serum biochemical values, normal urine specific gravity (when available), and the absence of renal and other abdominal diseases. The mean pre-contrast dimensions of the right kidney were 3.99 ± 0.33 cm in length, 2.76 ± 0.33 cm in width, 2.31 ± 0.21cm in height, whereas those of the left kidney were 3.91 ± 0.34 cm, 2.79 ± 0.29 cm, 2.44 ± 0.20 cm, respectively. The mean post-contrast renal cortical thickness for the right kidney was 0.49 ± 0.13 cm and for the left 0.49 ± 0.14 cm. Additionally, the renal length (RK or LK) was compared with the length of the second lumbar vertebra (L2) and the abdominal aorta diameter (Ao). The mean RK/L2 and LK/L2 ratios were 2.29 ± 0.19 and 2.24 ± 0.18, respectively, and the mean RK/Ao and LK/Ao ratios were 10.25 ± 1.25 and 10.04 ± 1.22, respectively. There was no statistically significant difference identified in the measurements between the kidneys. This study provides references for the feline renal size. Further studies are warranted to evaluate the application of these reference values in the clinical practice.
Introduction
Renal disease is common in the feline population, and chronic kidney disease (CKD) is the most common metabolic disease in domesticated cats, especially in older cats aged >12 years of age (Brown et al. 2016). In a study of longevity in companion animals in the United Kingdom, mortality was attributed to renal disorders in 12.1% of cats, with CKD being the most frequently (13.6%) identified cause at or after 5 years of age in cats (O’Neill et al. 2015).
Radiography and ultrasound are diagnostic imaging modalities commonly used for the assessment of renal disease in cats. Radiographically the renal size was first assessed by comparing its length to the length of the second lumbar vertebra (Barrett & Kneller 1972) and the normal feline kidney length is 2.4-3.0 times the length of the second lumbar vertebra (can be 1.9-2.6 times in older cats). Ultrasonographically the mean normal length of the feline kidneys described by Park et al. 2008, and it is 3.83± 0.51 cm for the left and 3.96± 0.48 cm for the right kidney. Ultrasonography is the imaging modality of choice for renal evaluation in dogs and cats because it provides information about the kidneys’ position, size, shape, internal architecture, and hemodynamics without harming the patient with radiation exposure (Bragato et al. 2017). In addition, ultrasound can help diagnose and monitor CKD and other renal pathology in cats. Based on a recent publication, decreased cortical thickness is observed in cats with loss of renal function that underwent ultrasonographic assessment and negatively correlates with disease progression (Yan et al. 2020).
Computed tomography (CT) is becoming more widely available to veterinary practitioners. Compared with conventional radiography, CT offers excellent tissue contrast and provides three-dimensional images that minimise the superimposition of organs. CT has been used to assess various organs and pathologies in veterinary medicine. So far, only one study, conducted in Thailand, has assessed the normal kidney dimensions in cats (Darawiroj & Choisunirachon 2019). Furthermore, to the authors’ knowledge, no study in the veterinary literature describes the renal cortical thickness of cats with normal renal function in CT.
The aims of this study were: (i) to determine the length, width and height of normal kidneys, (ii) to compare their length to the length of the second lumbar vertebra (L2) and the diameter of the aorta (Ao), and (iii) to provide the normal reference range values for the renal cortical thickness (RCT).
Materials and methods
Experimental design and subject selection criteria
This is a single-centre, retrospective study. The medical records and computed tomographic images of cats with a normal renal function referred at Dick White Referrals hospital between January 1, 2012, and January 1, 2020, were collected for analysis. Permission to use clinical and diagnostic imaging data for research was provided through informed consent from the owners at admission.
Cats that underwent a CT study including the abdomen to evaluate for non-renal pathology were assessed for the inclusion criteria. From the cases identified, cats with serum biochemical values and a urine specific gravity (if available) reflecting normal renal function (creatinine: 40-140μmol/L, urea: 6-10 mmol/L, USG: 1.035-1.060 g/dL) as sug gested by the International Renal Interest Society (IRIS) (www.iris-kidney.com, 2022), were included in this study. Cats with evidence of renal disease (e.g., degenerative, inflammatory/infectious or neoplastic renal disease, renal infarcts, nephrocalcinosis) or any other abdominal pathology in the CT study, abnormal renal serum biochemical values and/or abnormal urine specific gravity, and cats that the CT study performed after a traumatic episode, e.g., a road traffic accident (RTA), fall from height, were excluded from the study. The information collected from the medical records included breed, age, sex, neutered status and body weight (BW).
CT scan imaging protocol
After the pre-anaesthetic screening and examination, all cats underwent general anaesthesia. Each cat was positioned in sternal recumbency. The CT studies were conducted by the same 16-slice multidetector-row unit (MX-16 slice, Philips Healthcare), and they included the abdo men with or without other body parts depending on the reason of the study. Immediately after the end of the pre-contrast study, ioversol (Optiray 320mg/ml, Guerbet), a non-ionic iodinated contrast agent, was administered manually at a dose of 2 ml/kg through intravenous injection. The post-contrast scanning began 30-40 seconds post-injection using the same field of view (FOV) as the pre-contrast study. CT images were obtained as Digital and Communication in Medicine (DICOM) files.
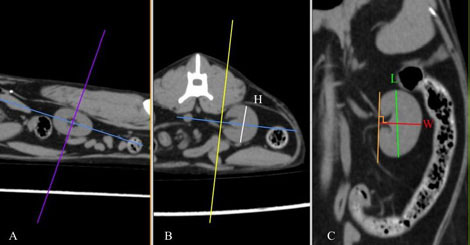
Figure 1. Multiplanar CT images of the left kidney of a cat demonstrating the measurement of each dimension in sagittal (A), transverse (B), and dorsal (C) planes. H, height; L, length; W, width. (source of the images: archive of Dick White Referrals)
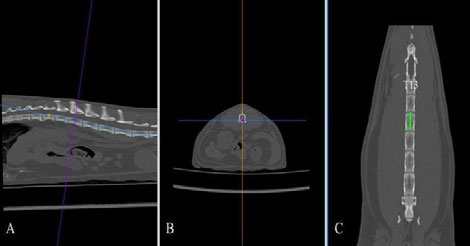
Figure 2. The length of the second lumbar vertebral body was measured in the dorsal plane (C, green line) after applying multiplanar reconstruction. T13, thirteenth thoracic vertebral body.
CT measurement methods and data analysis
DICOM images were analysed using a DICOM viewer (Osirix®, Pixmeo SARL). All data were displayed on a monitor device, and a soft tissue window (WL: 40, WW: 400) was selected for the best visualisation of both kidneys and related structures such as the renal vessels and aorta. A bone window (WL: 600, WW: 3000) was selected to assess and measure the length of the second lumbar vertebra (L2). Multiplanar reconstruction (MPR) was used in the pre-contrast studies in order to measure the maximum size of each renal dimension (length, width and height), the length of the second lumbar vertebra (L2) and the diameter of the abdominal aorta (Ao). The length of the L2 divided by the renal length (K) and Ao was used to calculate K/L2 and K/Ao ratios. The renal length and width were measured in the dorsal plane, and the height in the transverse plane using the MPR images (Figure 1). The renal length measured in the dorsal plane, by drawing a line from the most cranial edge of the cranial pole to the most caudal edge of the caudal pole of the kidney. The height was measured in the transverse plane vertical to the short axis line orientated from the middle of the renal pelvis to the periphery of the kidney (Figure 1B). For the width, first, a line connecting the cranial and caudal pole was drawn. Then the width was measured by drawing a line from the most lateral point of the renal capsule perpendicular to the line connecting the poles of the kidney passing through the middle of the renal pelvis (Figure1C). The length of the L2 was measured in the dorsal plane at the mid-level of the vertebral body (Figure 2), and the aorta diameter was measured in the dorsal plane immediately caudally to the left renal artery (Figure 3). All measurements for the renal dimensions, L2 and Ao were performed three times, and the maximal dimension was selected for each kidney.
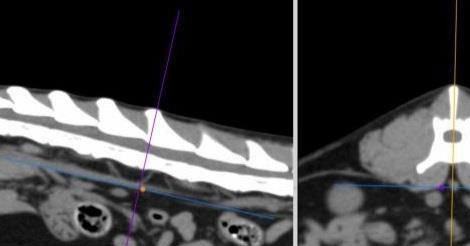
Figure 3. Measurement of the aorta diameter on the dorsal plane (C) after applying multiplanar reconstruction. Ao, aorta diameter; LRA, left renal artery; RRA, right renal artery.
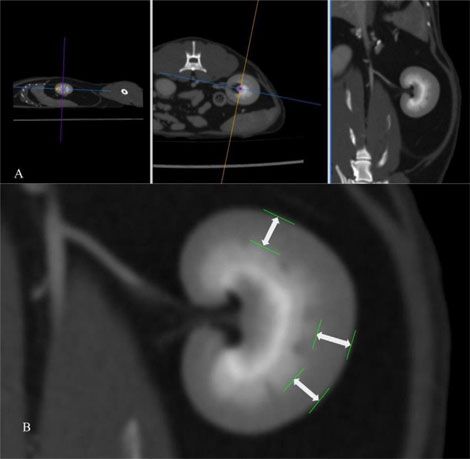
Figure 4. Post- contrast CT study in a soft tissue window after application of multiplanar reconstruction (A). After MPR, the renal cortical thickness is measured on the dorsal plane (B) as the distance from the leading edge of the base of the medullary pyramid to the trailing edge of the renal capsule at 3 points (white arrows), where the broad base of the medullary pyramid is clearly observed.
The Renal Cortical Thickness (RCT) of each kidney was measured in the post-contrast series to improve the delineation between the renal medulla and cortex for a more accurate thickness assessment of the latter. The RCT was measured on the dorsal plane, in 3 points, where the broad base of the medullary pyramid was clearly delineated. For the measurement of the RCT, a line was drawn perpendicular to two conceivable parallel lines representing the edge of the base of the medullary pyramid and the edge of the renal capsule (Figure 4). Subsequently, the three measurements were averaged, and the mean value was used for each kidney.
All measurements were performed by a single operator (P.M.) on a single occasion without knowledge of the patients’ history and signalment.
Statistical analysis
The age, body weight, abdominal aortic diameter, length of the second lumbar vertebra, the renal dimensions, the renal cortical thickness, and the K/L2 and K/Ao ratios were expressed as mean ± SD. Finally, the mean values were compared by running independent samples t-test. All statistical analyses were performed using statistical software (IBM SPSS statistics, version 26.0, Chicago, IL, USA), and statistical significance was set as p˂ 0.05.
Results
A total of 262 cats had an abdominal CT during the study period. From these, 10 female neutered cats and 4 male neutered cats met the inclusion criteria. Eleven cats were domestic shorthair and three were domestic long hair. The mean age was 9.47 ± 3.5 (range: 3.25-14.42) years. The mean body weight of the population of cats in this study was 4.27 ± 0.96 (range: 2.2–5.8) kg. The mean length of the L2 was 1.75 ± 0.12 (range: 1.56–1.97) cm, and the mean diameter of the Ao was 0.39 ± 0.04 (range: 0.32-0.48) cm.
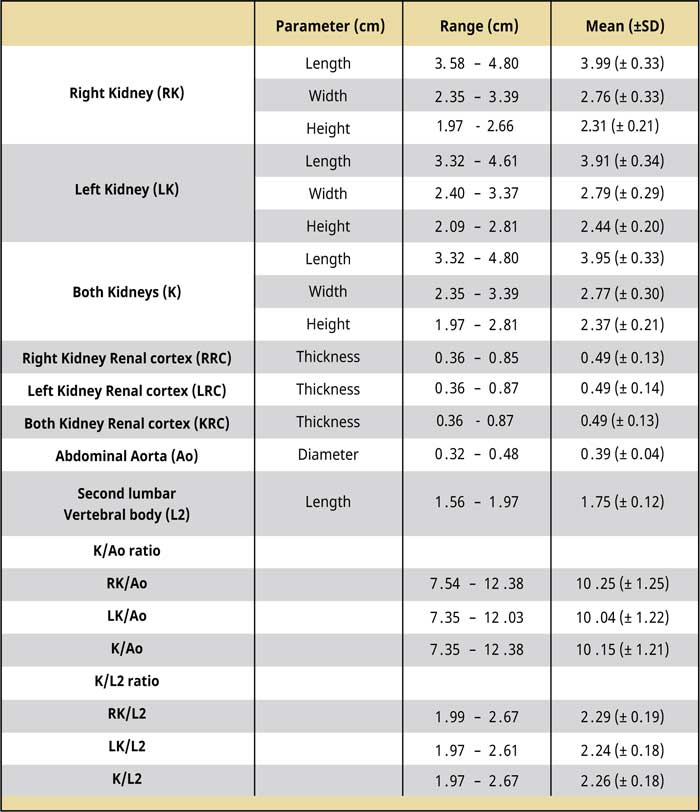
Table 1.
CT dimensions of kidneys, the maximal diameter of the abdominal aorta, and the length of the second lumbar vertebra as measured before the injection of contrast medium (pre-contrast studies). The renal cortex thickness as measured after the injection of contrast medium (post-contrast studies).
Abbreviations:
Ao Abdominal aorta diameter
K Kidney length
RK Right kidney length
LK Left kidney length
SD Standard deviation
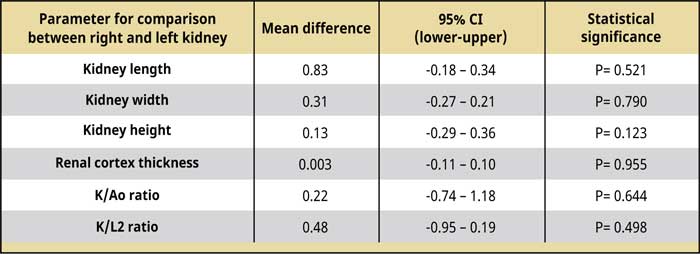
Table 2.
Comparison of the dimensions, Κ/Αο, Κ/L2, and renal cortex thickness between the right and left kidney.
Abbreviations:
Ao Maximal abdominal aorta diameter
CI Confidence interval
K Kidney length
L2 Length of the second lumbar vertebra
The kidney dimensions, K/Ao, and K/L2 ratios, the renal cortical thickness, and the comparison results between the two kidneys are shown in Tables 1 and 2. The right kidney had a mean length of 3.99 ± 0.33 (range: 3.58-4.8) cm, a mean width of 2.76 ± 0.33 (range: 2.35-3.39) cm, and a mean height of 2.31 ± 0.21 (range: 1.97-2.66) cm, whereas the mean left renal length was 3.91 ± 0.34 (range: 3.32-4.61) cm, the mean width was 2.79 ± 0.29 (range: 2.4-3.37) cm, and the mean height was 2.44 ± 0.2 (range: 2.09-2.81) cm. There was no statistically significant difference in the length, width, and height (P= 0.521; P= 0.790; P= 0.123, respectively) between the two kidneys. Including the values from right and left renal measurement, the mean renal length was 3.95 ± 0.33 (range: 3.32-4.8) cm, the mean renal width was 2.77 ± 0.3 (range: 2.35-3.39) cm, and the mean renal height was 2.37 ± 0.21 (range: 1.97-2.81) cm. The mean K/Ao ratio for the right kidney was 10.25 ± 1.25 (range: 7.54-12.38), while the K/ L2 ratio was 2.29 ± 0.19 (range: 1.99-2.67). The corresponding measurements for the left kidney were 10.04 ± 1.22 (range: 7.35-12.03) and 2.24 ± 0.18 (range: 1.97-2.61), respectively. There was no statistically significant difference between the two kidneys in the mean K/Ao and K/L2 ratios (P=0.644; P=0.498, respectively). The mean K/Ao and K/L2 ratios, when measured including measurements from both kidneys, were 10.15 ± 1.21 (range: 7.35-12.38) and 2.26 ± 0.18 (range: 1.972.67), respectively.
Regarding the renal cortical thickness, the mean renal cortical thickness was 0.49 ± 0.13 (range: 0.36-0.85) cm thick in the right kidney, while in the left kidney, it was 0.49 ± 0.14 (range: 0.36-0.87) cm thick, and the difference between the two kidneys was not statistically significant (P= 0.955). Finally, including the renal cortex thickness measurements from both kidneys, the mean renal cortical thickness was 0.49 ± 0.13 (range: 0.36-0.87) cm thick.
Discussion
This retrospective study shows that measuring kidney dimensions and renal cortical thickness in CT studies of cats is feasible. In our study, we concluded that the mean pre-contrast dimensions of the right kidney were 3.99 ± 0.33 cm in length, 2.76 ± 0.33 cm in width, 2.31 ± 0.21cm in height, whereas those of the left kidney were 3.91 ± 0.34 cm, 2.79 ± 0.29 cm, 2.44 ± 0.20 cm, respectively. The mean RK/L2 and LK/L2 ratios were 2.29 ± 0.19 and 2.24 ± 0.18, respectively, and the mean RK/ Ao and LK/Ao ratios were 10.25 ± 1.25 and 10.04 ± 1.22, respectively. The mean post-contrast renal cortical thickness for the right kidney was 0.49 ± 0.13 cm and for the left 0.49 ± 0.14 cm. There was no statistically significant difference identified in the measurements between the kidneys in our study.
In the veterinary literature, there are published reports of kidney dimensions in different modalities. For example, in ultrasound, feline kidneys can measure 3.2 to 4.1 cm in length, 2.2 to 2.8 cm in width, and 1.9 to 2.5 cm in height, according to Walter et al. 1987. These results are in agreement with a most recent ultrasonographic study (Park et al. 2008). In the same study by Park et al. 2008, the authors measured the renal cortical thickness that was 0.47 ± 0.08 cm in the left kidney and 0.47 ± 0.08 cm in the right kidney and the gross-anatomical renal dimension measurements showed no significant difference compared to the ultrasonographic measurements. The normal renal length in radiography is considered to be 2.4-3.0 times the length of the second lumbar vertebra (Barrett & Kneller 1972). So far, there is only one published study assessing the feline renal morphological characteristics in CT (Darawiroj and Choisunirachon 2019). In this study, the pre-contrast CT renal dimensions were 3.54 ± 0.46 cm in length, 2.45 ± 0.27 cm in width, and 2.05 ±0.23 cm in height for the right kidney and 3.52 ± 0.44 cm, 2.46 ± 0.28, and 2.19 ± 0.31 cm for the left kidney. To the authors’ knowledge, there is only one MRI study assessing the renal dimensions, but it is breed-specific for Persian cats (Dabanoglu & Pekoguz 2022).
The reference ranges described in ultrasound (Walter et al., 1987 Park et al. 2008) and radiographs (Barrett & Kneller 1972) mentioned above, differ slightly from the results of our study, with these two modalities underestimating the renal size compared to the CT measurements of our study. This underestimation might be explained by the fact that CT multiplanar reconstruction allows a more reliable measurement providing three-dimensional images of the kidneys compared to the two-dimensional ones that radiographs and ultrasound provide, as described in the human literature (Larson et al. 2011).
The renal dimensions reported in our study disagree with the results of a CT study conducted on a healthy population of cats in Thailand (Darawiroj & Choisunirachon 2019). The techniques used for measuring the renal dimensions in this study are almost identical, apart from the width measurement, which was performed slightly differently than in our study. The average dimensions were lower in the population of cats in Thailand. The difference in the results might be related to the fact that the authors in the previous study included cats under the age of seven months, which might have reduced the average kidney dimensions and/or reflect a difference in the kidney dimensions between Asian cats and cats in the UK. According to an author’s experience (Mantis 2022, p. 87), some Asian breeds of cats might have a renal length as low as 3.5 cm. Another difference in our study was that our population of cats consisted of only neutered cats, while the population of cats in the study conducted in Thailand consisted of both neutered and entire cats. In the existing veterinary literature, it has been reported that the reproductive status of the feline patient might affect the size of the kidneys, with neutered cats usually having smaller kidney sizes (Shiroma et al. 1999), so the difference found in our population might not reflect the actual difference and could be even higher if entire cats were included in our study. This observation raises a further suspicion that the kidney dimensions of Asian cats might be smaller than the cats in the UK. Finally, the mean K/L2 and K/ Ao ratios, 2.22 ± 0.23 and 10.36 ± 1.33, reported by Darawiroj & Choisunirachon 2019, were in slightly better agreement with our results of 2.26 ± 0.18 and 10.15 ± 1.21, respectively. That might be associated with the more stable length of the second lumbar vertebra and aorta diameter independently of the cat’s size, age, and gender. However, further studies with a bigger sample size are warranted before drawing into conclusions.
To the authors’ knowledge, this is the first study attempting to measure the renal cortical thickness in CT. The average renal cortical thickness of the right kidney was 0.49 ± 0.13 cm thick and 0.49 ± 0.14 cm in the left kidney. In the human literature, an ultrasonographic study (Beland et al. 2010) showed that RCT is more closely related to the estimated glomerular filtration rate (eGFR) compared to the kidneys’ length. Furthermore, an ultrasonographic study in cats has shown that cortical thickness has a stronger linear correlation with the reciprocal of the serum creatinine concentrationand superior diagnostic performance of CKD compared to other kidney dimensions (Yan et al. 2020). This study concluded that decreased renal cortical thickness is observed in cats with loss of renal function, and measurement of cortical thickness using ultrasonography could be a valuable method to evaluate CKD progression in cats. Based on that, the reference values provided here might be beneficial in the future for the detection and monitoring of CKD in cats based on CT, although the results should be interpreted with caution due to the small sample size in our study and further studies are warranted before drawing any conclusions.
Our study has also some limitations. The small sample size, the absence of gross anatomy to correlate to the actual size of the kidney, and the lack of histopathology to confirm the lack of renal disease are some drawbacks of this study. The study’s retrospective nature is another limitation as it does not allow the application of standardised protocols in the study design. Also, the USG was not available in all cats in this population. So that might affected the results of this study as we do not know if the remaining cases had a normal USG, and we relied upon the renal biochemical values only in these cases. In addition, the renal values assessed omitted the most recent symmetric dimethylarginine (SDMA) serum renal biomarker that allows detection of CKD earlier in cats compared to serum creatinine values (Hall et al. 2014).
In conclusion, this study shows that measurement of the renal dimensions in cats is feasible by using CT and the mean pre-contrast dimensions of the right kidney are 3.99 ± 0.33 cm in length, 2.76 ± 0.33 cm in width, 2.31 ± 0.21cm in height, whereas those of the left kidney are 3.91 ± 0.34 cm, 2.79 ± 0.29 cm, 2.44 ± 0.20 cm, respectively. The dimensions of the kidney when both kidneys counted together are 3.95 ± 0.33 cm in length, 2.77 ± 0.30 cm in width and 2.37 ± 0.21cm in height. The mean post-contrast renal cortical thickness for the right kidney is 0.49 ± 0.13 cm and for the left 0.49 ± 0.14 cm while, for both kidneys as a single measurement is 0.49 ± 0.13 cm. In addition, the renal cortical thickness reference provided in this study can be used in future studies to evaluate and monitor CKD in cats. Finally, further studies with a bigger sample size are warranted for more sensitive, specific and accurate measurement of the renal dimensions and to evaluate their application in the clinical setting.
Conflict of interest
The authors declare that there is no conflicts of interest.
Acknowledgements
The authors would like to thank Periandros Papamarkos for his assistance with the statistical analysis of the study.
References
- Barrett RB, Kneller SK (1972) Feline kidney mensuration. Acta Radiol Suppl 319, 279-80.
- Beland MD, Walle NL, Machan JT, Cronan JJ (2010) Renal cortical thickness measured at ultrasound: is it better than renal length as an indicator of renal function in chronic kidney disease? A JR Am J Roentgenol 195, W1469.
- Bragato N, Borges NC, Fioravanti MC (2017) B-mode and Doppler ultrasound of chronic kidney disease in dogs and cats. Vet Res Commu, 41, 307-315.
- Brown A, Elliott J, Schmiedt CW, Brow A (2016) Chronic Kidney Disease in Aged Cats: Clinical Features, Morphology, and Proposed Pathogeneses. Vet Pathol, 53, 309-26.
- Dabanoglu I, Pekoguz NC (2020) Normal values of the kidney in Persian cats by MRI. Israel Journal of Veterinary Medicine Vol.77 (1), 38-43.
- Darawiroj D, Choisunirachon N, (2019) Morphological assessment of cat kidneys using computed tomography. Anat Histol Embryol 48, 358-365.
- Hal J, Yerramilli M, Obar E, Yerramilli M, Jewel DE (2014) Comparison of serum concentrations of symmetric dimethylarginine and creatinine as kidney function biomarkers in cats with chronic kidney disease. J Vet Intern Med, 28, 1676-83.
- Larson DB, Meyers ML, O’har SM (2011) Reliability of renal length measurements made with ultrasound compared with measurements from helical CT multiplanar reformat images. A JR Am J Roentgenol 196, W592-7.
- Mantis P (2022) In: Practical small animal ultrasonography: abdomen. 2nd ed. Grupo Asís, Zaragoza, Spain, p. 87.
- O’neill DG, Church DB, McGreevy PD, Thomson PC, Brodbelt DC (2015) Longevity and mortality of cats attending primary care veterinary practices in England. J Feline Med Surg 17, 125-33.
- Park IC, Lee S., Kim JT, Nam SJ, Choi R, Oh KS, Son CH, Hyun C (2008) Ultrasonographic evaluation of renal dimension and resistive index in clinically healthy Korean domestic short-hair cats. J Vet Sci 9, 415-9.
- Shiroma JT, Gabriel JK, Carter RL, Scruggs SL, Stubbs PW (1999). Effect of reproductive status on feline renal size. Vet Radiol Ultrasound 40, 242-5.
- Yan GY, Chen KY, Wang HC, Ma TY, Chen KS (2020) Relationship between ultrasonographically determined renal dimensions and International Renal Interest Society stages in cats with chronic kidney disease. J Vet Intern Med 34, 1464-1475.
- www.iris-kidney.com. (2022). IRIS Kidney. [online]
- Available at: http://www.iris-kidney.com/index.html.
Corresponding author:
Thomas Natsiopoulos
e-mail: This email address is being protected from spambots. You need JavaScript enabled to view it.